73 Interpreter Training Programs (ITPs) Include K12 Education Components in Curricula
Issue: There appears to be inconsistent curricula about K12 educational interpreting across Minnesota’s ITPs. K12 educational interpreters wish for more formal education about EIPA and IEPs specifically.
Proposed Solution: Minnesota’s ITPs review their curricula on educational interpreting and determine if any revisions are necessary. ITPs can also ask for input from graduates from their programs in the past 5 years.
Expected outcome: Interpreting students will be better prepared to work as K12 educational interpreters. K12 students will receive better services.
Who is impacted: Prospective K12 educational interpreters
Timeline: 6 months
Note: Some ITPs may already include K12 educational interpreting.

Summary of Support Image Description
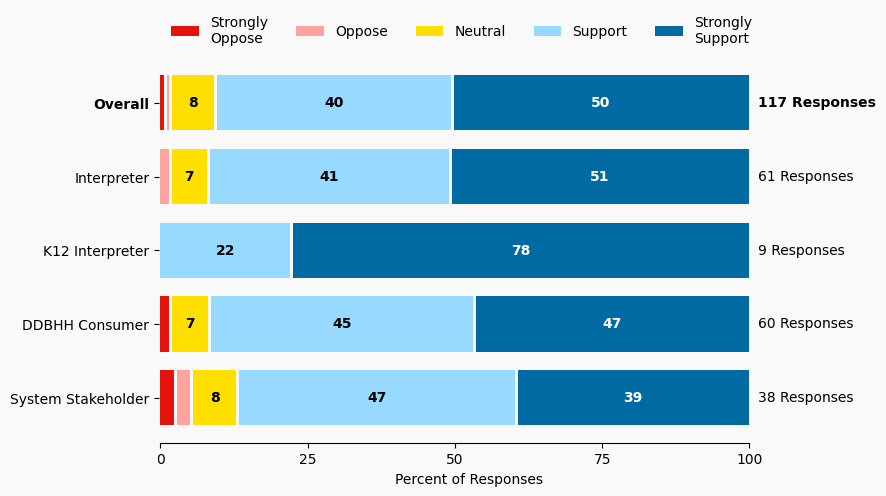
The stacked bar charts show how respondents rated their level of support and the total number of responses. The percentage for the five support levels is shown from left to right: Strongly Oppose (Dark Red), Oppose (Light Red), Neutral (Yellow), Support (Light Blue), and Strongly Support (Dark Blue).
Respondents may identify with multiple subgroups. The overall level of support is:
Overall
Strongly Oppose: 1%
Oppose: 1%
Neutral: 8%
Support: 40%
Strongly Support: 50%
Click to see the detailed image description for each subgroup.
Interpreter
Strongly Oppose: 0%
Oppose: 2%
Neutral: 7%
Support: 41%
Strongly Support: 51%
K12 Interpreter
Strongly Oppose: 0%
Oppose: 0%
Neutral: 0%
Support: 22%
Strongly Support: 78%
DDBHH Consumer
Strongly Oppose: 2%
Oppose: 0%
Neutral: 7%
Support: 45%
Strongly Support: 47%
System Stakeholder
Strongly Oppose: 3%
Oppose: 3%
Neutral: 8%
Support: 47%
Strongly Support: 39%
Overview of Respondents Opting for In-Depth Solution Analysis
After indicating their support level, 4% of the 117 respondents opted in to further assess whether the solution would worsen or improve on five metrics. Of the opt-in reviewers (5 respondents), 100% supported the solution, 0% were neutral on the solution, and 0% opposed the solution.
The remaining 112 respondents did not opt in to further assess the solution. Of these people, 90% support the solution, 8% were neutral on the solution, and 1% opposed the solution.
Reviewer Evaluation of Solution Effectiveness

Solution Effectiveness Image Description
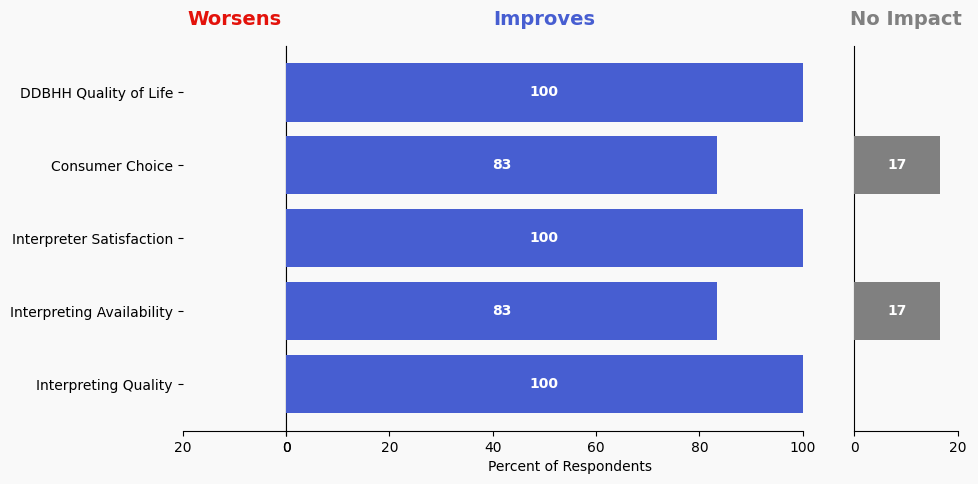
The stacked bar charts show how respondents assessed the effectiveness of this solution based on five metrics. For each metric, the percentage of respondents is shown from left to right: Worsens (Red), Improves (Blue), No Impact (Gray).
DDBHH Quality of Life
Makes It Worse 0%
Makes It Better 100%
No Impact 0%
Interpreter Satisfaction
Makes It Worse 0%
Makes It Better 100%
No Impact 0%
Consumer Choice
Makes It Worse 0%
Makes It Better 83%
No Impact 16%
Interpreting Availability
Makes It Worse 0%
Makes It Better 83%
No Impact 16%
Interpreting Quality
Makes It Worse 0%
Makes It Better 100%
No Impact 0%
Reviewer Feedback and Insights
Interpreter
Comments from Interpreters draw on their personal experiences. One comment notes that ITPs should be consulted on the proposed solutions and highlights that at St. Kate’s, students already receive education on K-12 interpreting and mentorship, but there are challenges in finding enough internship placements due to the limited number of staff interpreters in K-12. Another comment mentions that many interpreters start working in K-12 settings without intending to, often with minimal preparation, and suggests incorporating the EIPA Written Standards into required coursework to provide a better foundation.
Deaf, DeafBlind, Hard of Hearing
No comments were submitted.
System Stakeholder
One comment from a System stakeholder mentions that St. Kate’s has a comprehensive program that includes K-12 interpreting, but struggles with limited internship opportunities due to a lack of staff interpreters in K-12 settings.
PREVIOUS SOLUTION
72 Prevent Repetitive Motion Injury and Burnout by Hiring Team Interpreters in K12 Settings
Issue: K12 educational interpreters are not regularly provided team interpreters, thus leading to burnout and repetitive motion injuries.
NEXT SOLUTION
74 Advocate for Legislative Limits and Standards for K12 Interpreting Services
Issue: K12 educational interpreter standards are not closely regulated; DDBHH students suffer when placed in mainstream settings with no interpreter or an unqualified interpreter. Current job requirements, oversight, compensation and other crucial areas for ensuring highly qualified and valued interpreters for DDBHH youth are insufficient. Educational interpreters have great concerns and desire for more standards and support.
Leave a Reply