39 MRID Diversify Professional Social Events
Issue: Concerns have been raised about interpreters, particularly emerging interpreters, feeling a lack of connectedness to the interpreting community. Emerging interpreters do not have opportunities to develop relationships with interpreters at all stages in their career.network to support them, and are better prepared to work together in different settings.
Proposed Solution: MRID develop social and networking events to promote community, network, and professional dialogue. Example events include: game show style “get to know you as a professional”, happy hours, buddy system for new interpreters to Minnesota and to the field.
Expected outcome: higher interpreter retention due to supportive community network and sense of belonging.
Who is impacted: Interpreters
Timeline: 6 months

Summary of Support Image Description
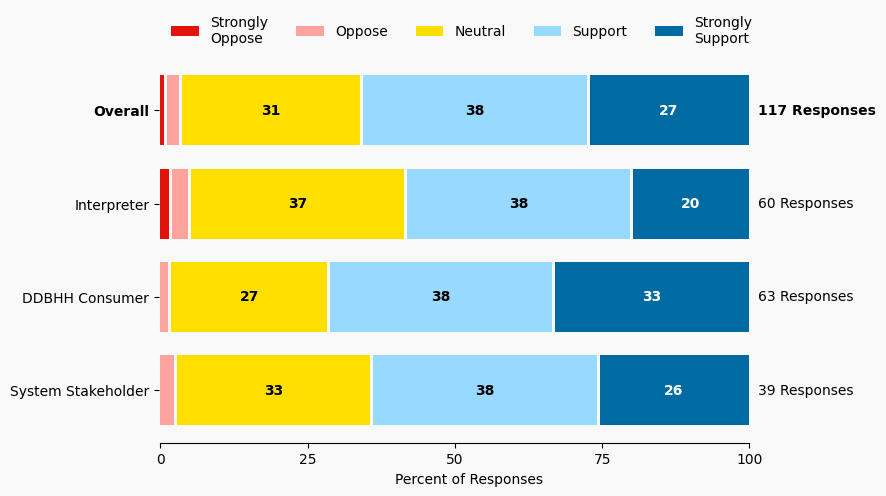
The stacked bar charts show how respondents rated their level of support and the total number of responses. The percentage for the five support levels is shown from left to right: Strongly Oppose (Dark Red), Oppose (Light Red), Neutral (Yellow), Support (Light Blue), and Strongly Support (Dark Blue).
Respondents may identify with multiple subgroups. The overall level of support is:
Overall
Strongly Oppose: 1%
Oppose: 3%
Neutral: 31%
Support: 38%
Strongly Support: 27%
Click to see the detailed image description for each subgroup.
Interpreter
Strongly Oppose: 2%
Oppose: 3%
Neutral: 37%
Support: 38%
Strongly Support: 20%
DDBHH Consumer
Strongly Oppose: 0%
Oppose: 2%
Neutral: 27%
Support: 38%
Strongly Support: 33%
System Stakeholder
Strongly Oppose: 0%
Oppose: 3%
Neutral: 33%
Support: 38%
Strongly Support: 26%
Overview of Respondents Opting for In-Depth Solution Analysis
After indicating their support level, 5% of the 117 respondents opted in to further assess whether the solution would worsen or improve on five metrics. Of the opt-in reviewers (6 respondents), 66% supported the solution, 33% were neutral on the solution, and 0% opposed the solution.
The remaining 111 respondents did not opt in to further assess the solution. Of these people, 65% support the solution, 30% were neutral on the solution, and 3% opposed the solution.
Reviewer Evaluation of Solution Effectiveness

Solution Effectiveness Image Description
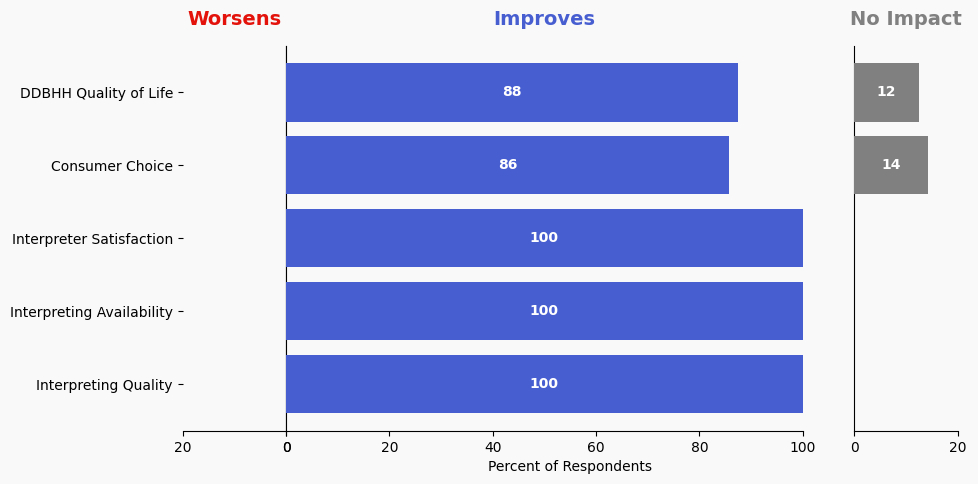
The stacked bar charts show how respondents assessed the effectiveness of this solution based on five metrics. For each metric, the percentage of respondents is shown from left to right: Worsens (Red), Improves (Blue), No Impact (Gray).
DDBHH Quality of Life
Makes It Worse 0%
Makes It Better 87%
No Impact 12%
Interpreter Satisfaction
Makes It Worse 0%
Makes It Better 100%
No Impact 0%
Consumer Choice
Makes It Worse 0%
Makes It Better 85%
No Impact 14%
Interpreting Availability
Makes It Worse 0%
Makes It Better 100%
No Impact 0%
Interpreting Quality
Makes It Worse 0%
Makes It Better 100%
No Impact 0%
Reviewer Feedback and Insights
Interpreter
Comments from Interpreters suggest that new interpreters need a sense of belonging and community, but mention that attendance rates for such events have been low. Comments point out that personal invitations and word-of-mouth seem to be more effective in gathering participants rather than adding more events to an already busy calendar.
Deaf, DeafBlind, Hard of Hearing
No comments were submitted.
System Stakeholder
Comments from System stakeholders echo the difficulty of getting interpreters to attend professional social events, noting that both MERGE and MRID have tried to host these with limited success. One comment suggests offering paid positions to plan events, noting that volunteer recruitment has been a challenge.
PREVIOUS SOLUTION
38 Host Semi-Annual DDBHH & Interpreter Community Forums on Interpreting Topics
Issue: There are no current venues for developing shared understanding about interpreting issues amongst DDBHH community members and Deaf and hearing interpreters.
NEXT SOLUTION
40 MRID Resolve to Host Annual Anti-Racism Workshops
Issue: Interpreters of color have regularly reported experiencing both explicit and subtle racist acts and microaggressions. As DDBHH consumers of color are woefully underserved by not having interpreters who reflect their identities, there is a need to support and encourage more interpreters of color in the field.
Leave a Reply