30 Minnesota-Based Interpreter Referral Companies Create Partnerships with Other Interpreter Referral Companies in Neighboring States
Issue: Greater Minnesota struggles to fill all interpreter requests.
Proposed Solution: Minnesota-based interpreter referral companies create partnerships with interpreter referrals based in neighboring states (Wisconsin, North Dakota, South Dakota, Iowa) to increase the pool of available interpreters through subcontracts. .
Expected outcome: More requests for interpreters in Greater Minnesota may be filled.
Who is impacted: Consumers in Greater Minnesota, Greater Minnesota interpreters
Timeline: 6 months

Summary of Support Image Description
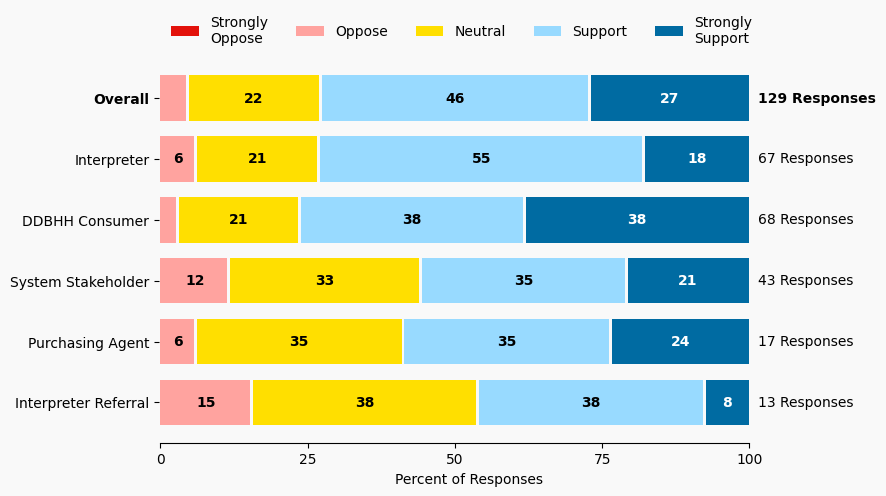
The stacked bar charts show how respondents rated their level of support and the total number of responses. The percentage for the five support levels is shown from left to right: Strongly Oppose (Dark Red), Oppose (Light Red), Neutral (Yellow), Support (Light Blue), and Strongly Support (Dark Blue).
Respondents may identify with multiple subgroups. The overall level of support is:
Overall
Strongly Oppose: 0%
Oppose: 5%
Neutral: 22%
Support: 46%
Strongly Support: 27%
Click to see the detailed image description for each subgroup.
Interpreter
Strongly Oppose: 0%
Oppose: 6%
Neutral: 21%
Support: 55%
Strongly Support: 18%
Purchasing Agent
Strongly Oppose: 0%
Oppose: 6%
Neutral: 35%
Support: 35%
Strongly Support: 24%
DDBHH Consumer
Strongly Oppose: 0%
Oppose: 3%
Neutral: 21%
Support: 38%
Strongly Support: 38%
Interpreter Referral
Strongly Oppose: 0%
Oppose: 15%
Neutral: 38%
Support: 38%
Strongly Support: 8%
System Stakeholder
Strongly Oppose: 0%
Oppose: 12%
Neutral: 33%
Support: 35%
Strongly Support: 21%
Overview of Respondents Opting for In-Depth Solution Analysis
No respondents opted in to further assess whether the solution would worsen or improve on five metrics.
Reviewer Evaluation of Solution Effectiveness

Solution Effectiveness Image Description
The stacked bar charts show how respondents assessed the effectiveness of this solution based on five metrics. For each metric, the percentage of respondents is shown from left to right: Worsens (Red), Improves (Blue), No Impact (Gray).
Reviewer Feedback and Insights
Interpreter
No comments were submitted.
Deaf, DeafBlind, Hard of Hearing
No comments were submitted.
System Stakeholder
No comments were submitted.
PREVIOUS SOLUTION
29 Establish a Code of Professional Conduct for Interpreter Referral Companies
Issue: Multiple concerns have been raised about interpreter referral company practices. There is no standardization of interpreter referral companies statewide or nationwide. RID and NAD have each discussed and held groups to work on developing standards, such as a Code of Professional Conduct, Better Business Bureau ratings, or similar system for providing guidance to interpreter referral companies. No such systems or guidance currently exist.
NEXT SOLUTION
31 Interpreter Referral Companies Establish and Maintain Self-Reporting to the Public
Issue: As private businesses that serve a business and social demand for communication services, information about services is generally not shared. There is a lack of knowledge about the scope of services, issue areas and fill rates.
Leave a Reply