21 Create Quality Specialist Position in State Government
Issue: No central position to support interpreting issues.
Proposed Solution: Commission or State Services establish a Quality Specialist position to advance interpreting related initiatives. Checks and balances, clear position description and transparent reporting would be built into this position to reduce it being politicized or gaining too much power.
Expected outcome: One clear person and office responsible to continue advancing initiatives relating to interpreting quality and availability.
Who is impacted: Consumers, interpreters
Timeline: 6 months

Summary of Support Image Description
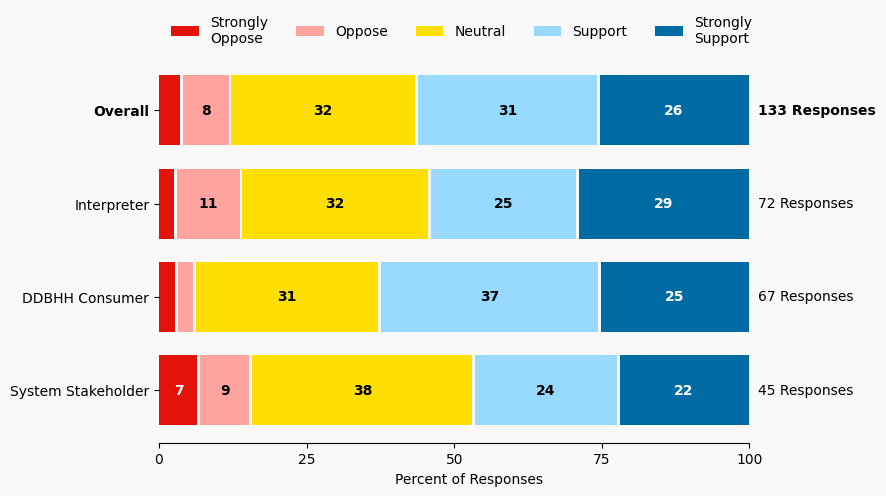
The stacked bar charts show how respondents rated their level of support and the total number of responses. The percentage for the five support levels is shown from left to right: Strongly Oppose (Dark Red), Oppose (Light Red), Neutral (Yellow), Support (Light Blue), and Strongly Support (Dark Blue).
Respondents may identify with multiple subgroups. The overall level of support is:
Overall
Strongly Oppose: 4%
Oppose: 8%
Neutral: 32%
Support: 31%
Strongly Support: 26%
Click to see the detailed image description for each subgroup.
Interpreter
Strongly Oppose: 3%
Oppose: 11%
Neutral: 32%
Support: 25%
Strongly Support: 28%
DDBHH Consumer
Strongly Oppose: 3%
Oppose: 3%
Neutral: 31%
Support: 37%
Strongly Support: 25%
System Stakeholder
Strongly Oppose: 7%
Oppose: 9%
Neutral: 38%
Support: 24%
Strongly Support: 22%
Overview of Respondents Opting for In-Depth Solution Analysis
After indicating their support level, 9% of the 133 respondents opted in to further assess whether the solution would worsen or improve on five metrics. Of the opt-in reviewers (13 respondents), 46% supported the solution, 23% were neutral on the solution, and 30% opposed the solution.
The remaining 120 respondents did not opt in to further assess the solution. Of these people, 57% support the solution, 32% were neutral on the solution, and 10% opposed the solution.
Reviewer Evaluation of Solution Effectiveness

Solution Effectiveness Image Description
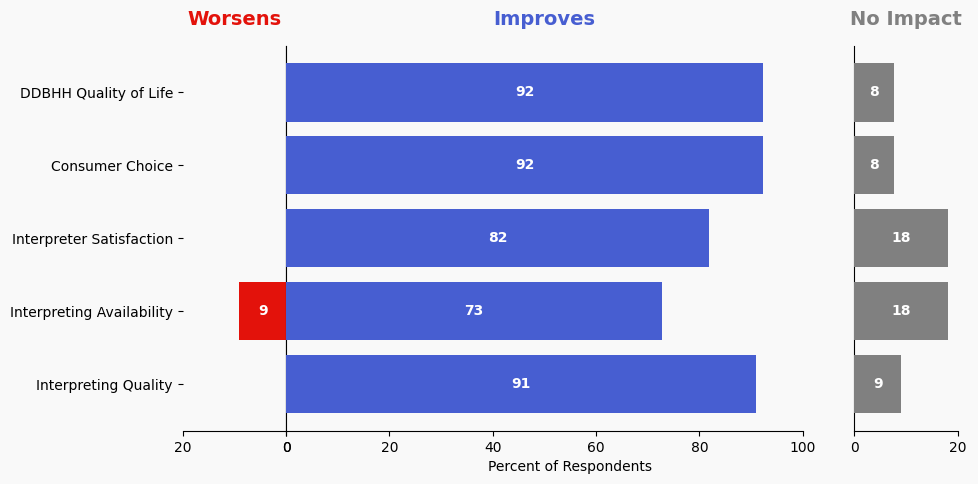
The stacked bar charts show how respondents assessed the effectiveness of this solution based on five metrics. For each metric, the percentage of respondents is shown from left to right: Worsens (Red), Improves (Blue), No Impact (Gray).
DDBHH Quality of Life
Makes It Worse 0%
Makes It Better 92%
No Impact 7%
Interpreter Satisfaction
Makes It Worse 0%
Makes It Better 81%
No Impact 18%
Consumer Choice
Makes It Worse 0%
Makes It Better 92%
No Impact 7%
Interpreting Availability
Makes It Worse 9%
Makes It Better 72%
No Impact 18%
Interpreting Quality
Makes It Worse 0%
Makes It Better 90%
No Impact 9%
Reviewer Feedback and Insights
Interpreter
Comments from Interpreters suggest concerns about balancing the needs of the Deaf and interpreter communities, noting the potential for the position to be caught between conflicting interests. Suggestion includes that this role could centralize interpreting expertise and support systems like K-12, case-consult groups, and mentoring, though funding and workload need careful consideration. Concerns also mention that this position might be better suited for an agency rather than an individual.
Deaf, DeafBlind, Hard of Hearing
Comments from DDBHH Consumers express support for the idea, suggesting it could be effective based on models in other states. One comment suggests a Deaf person should lead this effort, and there is interest in learning from other states’ experiences with similar roles.
System Stakeholder
Comments from System stakeholders suggest the initiative could pose challenges related to resource allocation and resistance to change from interpreters and employers. One comment expresses the need for clear role definitions and broad stakeholder engagement to ensure success. Another comment suggests hiring more than one quality specialist to better manage the workload and avoid overburdening a single person.
PREVIOUS SOLUTION
20 Make Interpreters State Employees
Issue: Interpreters working with government agencies experience varied levels of compensation, standards required, support and benefits.
NEXT SOLUTION
22 Host DeafBlind & Interpreter Meet-and-Greet
Issue: DeafBlind consumers are not familiar with all working interpreters who are available and have some qualifications for working with DeafBlind individuals. DeafBlind consumers are not able to expand their interpreter preference list without knowing the interpreters and their skills.
Leave a Reply