113 Hiring Entities Provide More Employment Options for Interpreter Compensation
Issue: Interpreters employment options are not flexible enough for retaining the interpreter workforce in some settings. A theme in reporting was interpreters needing regular full-time employment with benefits; however, not all interpreters are seeking full-time employment.
Proposed Solution: Workplaces seeking interpreters provide different employment options, including full-time regular employment with benefits, part-time regular employment with benefits, casual temporary employment with minimal benefits, independent contractor, and/or subcontracting through an interpreter referral company.
Expected outcome: Interpreters having greater choices in employment are more likely to have their basic income and living needs met; fewer interpreters would leave the field due to compensation models not fitting their daily living needs.
Who is impacted: Interpreters, hiring entities, consumers
Timeline: 6 months

Summary of Support Image Description
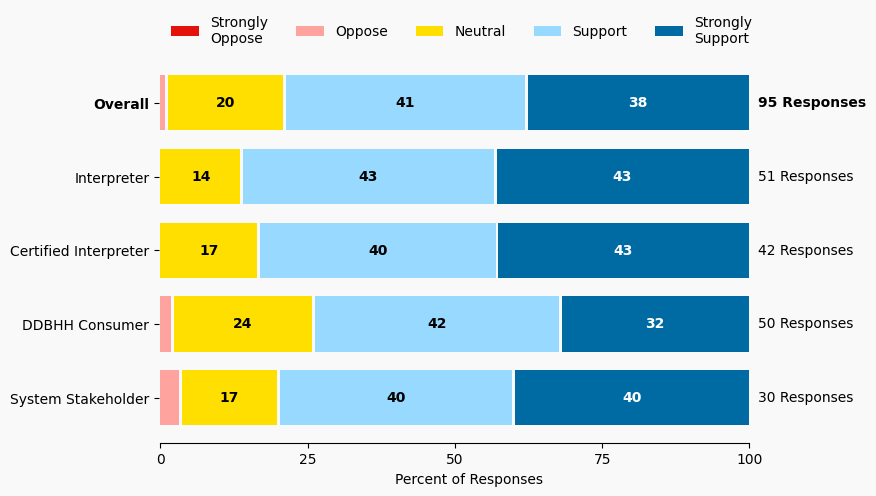
The stacked bar charts show how respondents rated their level of support and the total number of responses. The percentage for the five support levels is shown from left to right: Strongly Oppose (Dark Red), Oppose (Light Red), Neutral (Yellow), Support (Light Blue), and Strongly Support (Dark Blue).
Respondents may identify with multiple subgroups. The overall level of support is:
Overall
Strongly Oppose: 0%
Oppose: 1%
Neutral: 20%
Support: 41%
Strongly Support: 38%
Click to see the detailed image description for each subgroup.
Interpreter
Strongly Oppose: 0%
Oppose: 0%
Neutral: 14%
Support: 43%
Strongly Support: 43%
Certified Interpreter
Strongly Oppose: 0%
Oppose: 0%
Neutral: 17%
Support: 40%
Strongly Support: 43%
DDBHH Consumer
Strongly Oppose: 0%
Oppose: 2%
Neutral: 24%
Support: 42%
Strongly Support: 32%
System Stakeholder
Strongly Oppose: 0%
Oppose: 3%
Neutral: 17%
Support: 40%
Strongly Support: 40%
Overview of Respondents Opting for In-Depth Solution Analysis
After indicating their support level, 7% of the 95 respondents opted in to further assess whether the solution would worsen or improve on five metrics. Of the opt-in reviewers (7 respondents), 71% supported the solution, 28% were neutral on the solution, and 0% opposed the solution.
The remaining 88 respondents did not opt in to further assess the solution. Of these people, 79% support the solution, 19% were neutral on the solution, and 1% opposed the solution.
Reviewer Evaluation of Solution Effectiveness

Solution Effectiveness Image Description
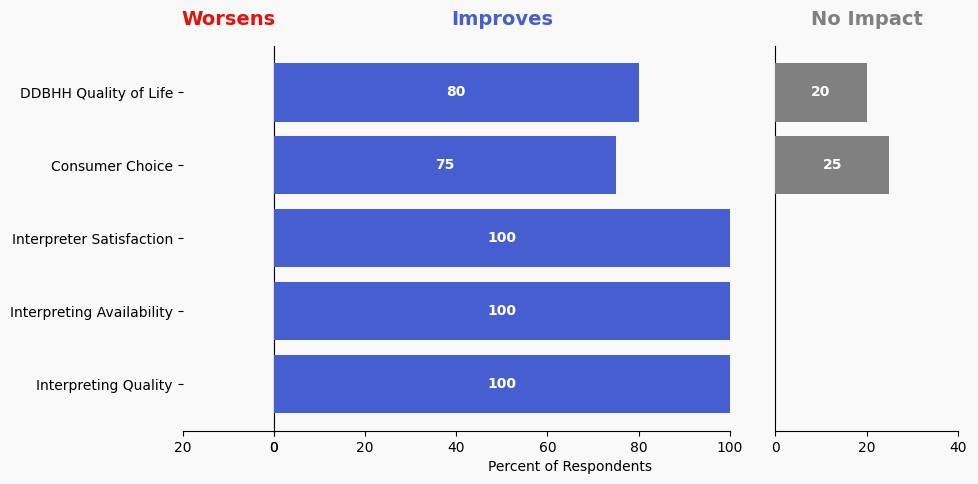
The stacked bar charts show how respondents assessed the effectiveness of this solution based on five metrics. For each metric, the percentage of respondents is shown from left to right: Worsens (Red), Improves (Blue), No Impact (Gray).
DDBHH Quality of Life
Makes It Worse 0%
Makes It Better 80%
No Impact 20%
Interpreter Satisfaction
Makes It Worse 0%
Makes It Better 100%
No Impact 0%
Consumer Choice
Makes It Worse 0%
Makes It Better 75%
No Impact 25%
Interpreting Availability
Makes It Worse 0%
Makes It Better 100%
No Impact 0%
Interpreting Quality
Makes It Worse 0%
Makes It Better 100%
No Impact 0%
Reviewer Feedback and Insights
Interpreter
No comments were submitted.
Deaf, DeafBlind, Hard of Hearing
Comments from DDBHH Consumers suggest the possibility of establishing a pension fund for interpreters to encourage long-term retention in the field.
System Stakeholder
Comments from System stakeholders highlight the need for a range of options, flexibility, structure, and measurability in interpreter compensation.
PREVIOUS SOLUTION
112 Centralize Information about Communities of Practice on a Website
Issue: Interpreters often experience vicarious trauma, compassion fatigue and related issues due to working in stressful settings. Interpreters need mental health supports in place
NEXT SOLUTION
114 Develop More Communities of Practice as Professional Supports for Interpreters
Issue: Interpreters need more opportunities to develop skills and a support network.
Leave a Reply