69 Create Roster of Interpreters Qualified to Work in K12
Issue: There is no public roster of Certified Interpreters qualified to work in K12 educational settings.
Proposed Solution: Interpreter referral companies work with Minnesota Department of Education to create a public roster of Certified Deaf Interpreters and Certified Hearing Interpreters qualified to work in K12 settings.
Expected outcome: Hiring entities will be able to find interpreters who are qualified to work in K12 settings. Hiring entities can verify whether applicants are qualified to work in K12 settings or if they need to work on waivers and receive focused supervision and mentoring until the interpreter becomes qualified.
Who is impacted: Consumers, interpreters, hiring entities
Timeline: 6 months

Summary of Support Image Description
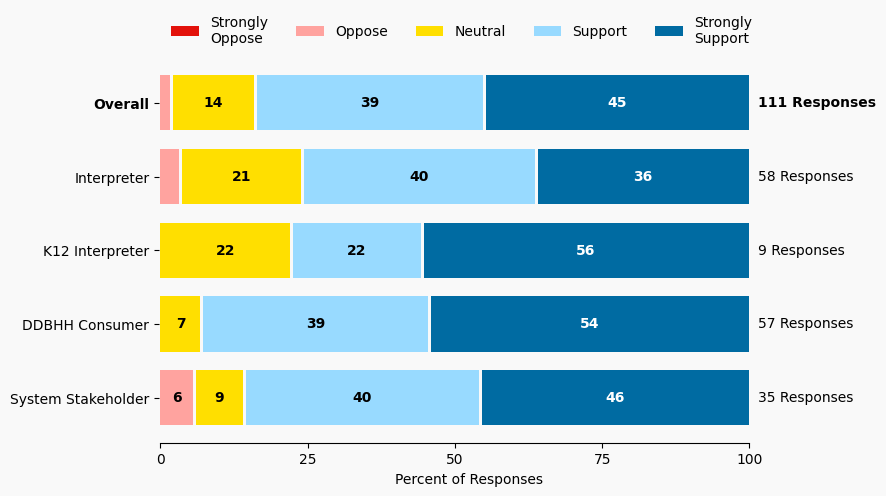
The stacked bar charts show how respondents rated their level of support and the total number of responses. The percentage for the five support levels is shown from left to right: Strongly Oppose (Dark Red), Oppose (Light Red), Neutral (Yellow), Support (Light Blue), and Strongly Support (Dark Blue).
Respondents may identify with multiple subgroups. The overall level of support is:
Overall
Strongly Oppose: 0%
Oppose: 2%
Neutral: 14%
Support: 39%
Strongly Support: 45%
Click to see the detailed image description for each subgroup.
Interpreter
Strongly Oppose: 0%
Oppose: 3%
Neutral: 21%
Support: 40%
Strongly Support: 36%
K12 Interpreter
Strongly Oppose: 0%
Oppose: 0%
Neutral: 22%
Support: 22%
Strongly Support: 56%
DDBHH Consumer
Strongly Oppose: 0%
Oppose: 0%
Neutral: 7%
Support: 39%
Strongly Support: 54%
System Stakeholder
Strongly Oppose: 0%
Oppose: 6%
Neutral: 9%
Support: 40%
Strongly Support: 46%
Overview of Respondents Opting for In-Depth Solution Analysis
After indicating their support level, 2% of the 111 respondents opted in to further assess whether the solution would worsen or improve on five metrics. Of the opt-in reviewers (3 respondents), 100% supported the solution, 0% were neutral on the solution, and 0% opposed the solution.
The remaining 108 respondents did not opt in to further assess the solution. Of these people, 83% support the solution, 14% were neutral on the solution, and 1% opposed the solution.
Reviewer Evaluation of Solution Effectiveness

Solution Effectiveness Image Description
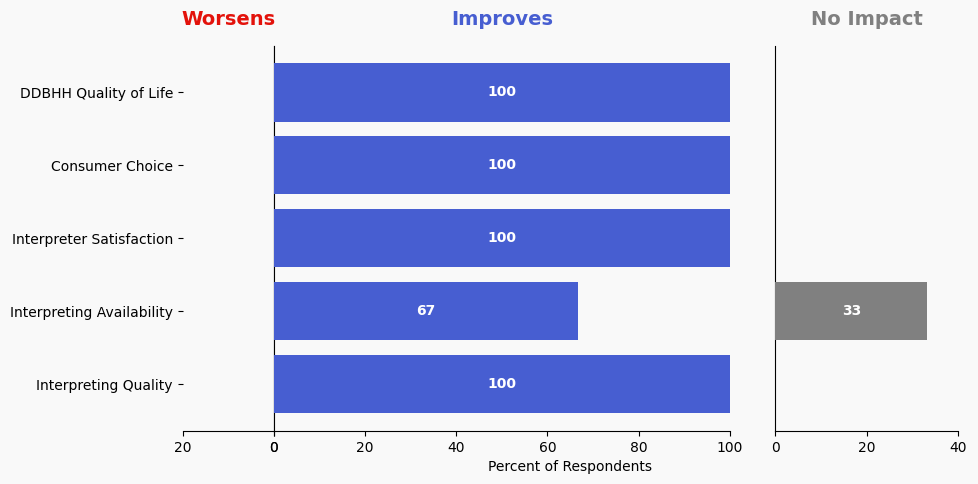
The stacked bar charts show how respondents assessed the effectiveness of this solution based on five metrics. For each metric, the percentage of respondents is shown from left to right: Worsens (Red), Improves (Blue), No Impact (Gray).
DDBHH Quality of Life
Makes It Worse 0%
Makes It Better 100%
No Impact 0%
Interpreter Satisfaction
Makes It Worse 0%
Makes It Better 100%
No Impact 0%
Consumer Choice
Makes It Worse 0%
Makes It Better 100%
No Impact 0%
Interpreting Availability
Makes It Worse 0%
Makes It Better 66%
No Impact 33%
Interpreting Quality
Makes It Worse 0%
Makes It Better 100%
No Impact 0%
Reviewer Feedback and Insights
Interpreter
Comments from Interpreters raise the question of differentiating between certifications, such as NIC and EIPA, as not all certifications qualify interpreters for every educational setting. One comment expresses concern around privacy issues, with some interpreters possibly not wanting their information publicly accessible. Another comment notes that maintaining an up-to-date roster is highlighted as a time-consuming task, and whichever entity is responsible should be prepared for the long-term commitment.
Deaf, DeafBlind, Hard of Hearing
No comments were submitted.
System Stakeholder
No comments were submitted.
PREVIOUS SOLUTION
Issue: Severe shortage of qualified interpreters in K12 settings due to hiring and staffing practices of K12 administrators (principals, human resource offices, special education directors, PELSB)
NEXT SOLUTION
70 MDE Promote NTID Course for Provisionally Licensed K12 Interpreters
Issue: Provisionally licensed K12 interpreters need resources for flexible professional development.
Leave a Reply