68 Create and Share Resources for Advocating about Quality Interpreting Services with K12 Education Administrators
Issue: Severe shortage of qualified interpreters in K12 settings due to hiring and staffing practices of K12 administrators (principals, human resource offices, special education directors, PELSB)
Proposed Solution: A coalition, in conjunction with the Commission, Department of Education and working educational interpreters could work together to develop succinct materials to share with administrators and families of children who are DDBHH. Materials would educate about the importance of highly qualified hearing and Deaf interpreters in the classroom. The packet of materials would include a sample standardized job description for educational interpreters, to clarify requirements and scope of responsibility, including participation in IEPs and professional development.
Expected outcome: DDBHH students would have better educational outcomes; therefore, becoming better educated citizens with better job prospects. Improved quality and availability of educational interpreters. Informing administrators and families about the need for qualified hearing and Deaf interpreters, in conjunction with licensing educational interpreters through PELSB, would significantly improve the working conditions due to clear and appropriate scope of work, higher pay, recognition and support.
Who is impacted: DDBHH children in mainstream educational settings, educational interpreters, school districts, parents and guardians
Timeline: 6 months

Summary of Support Image Description
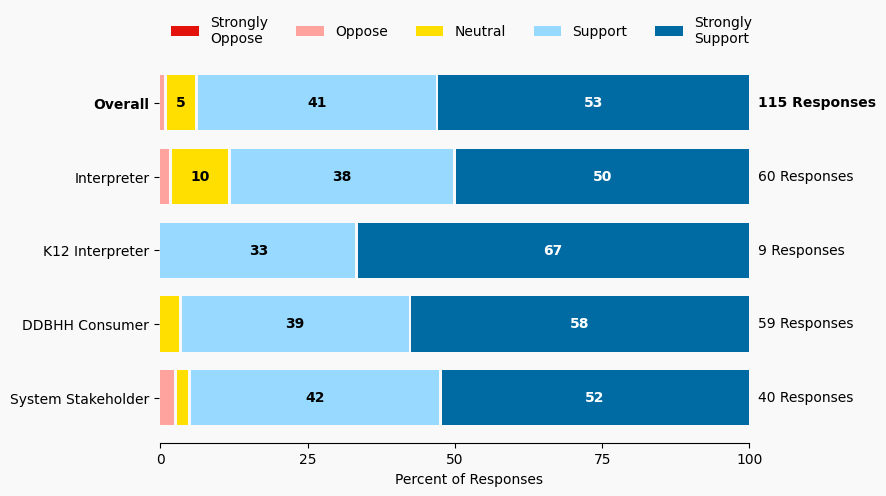
The stacked bar charts show how respondents rated their level of support and the total number of responses. The percentage for the five support levels is shown from left to right: Strongly Oppose (Dark Red), Oppose (Light Red), Neutral (Yellow), Support (Light Blue), and Strongly Support (Dark Blue).
Respondents may identify with multiple subgroups. The overall level of support is:
Overall
Strongly Oppose: 0%
Oppose: 1%
Neutral: 5%
Support: 41%
Strongly Support: 53%
Click to see the detailed image description for each subgroup.
Interpreter
Strongly Oppose: 0%
Oppose: 2%
Neutral: 10%
Support: 38%
Strongly Support: 50%
K12 Interpreter
Strongly Oppose: 0%
Oppose: 0%
Neutral: 0%
Support: 33%
Strongly Support: 67%
DDBHH Consumer
Strongly Oppose: 0%
Oppose: 0%
Neutral: 3%
Support: 39%
Strongly Support: 57%
System Stakeholder
Strongly Oppose: 0%
Oppose: 2%
Neutral: 2%
Support: 42%
Strongly Support: 52%
Overview of Respondents Opting for In-Depth Solution Analysis
After indicating their support level, 5% of the 115 respondents opted in to further assess whether the solution would worsen or improve on five metrics. Of the opt-in reviewers (6 respondents), 100% supported the solution, 0% were neutral on the solution, and 0% opposed the solution.
The remaining 109 respondents did not opt in to further assess the solution. Of these people, 93% support the solution, 5% were neutral on the solution, and 0% opposed the solution.
Reviewer Evaluation of Solution Effectiveness

Solution Effectiveness Image Description
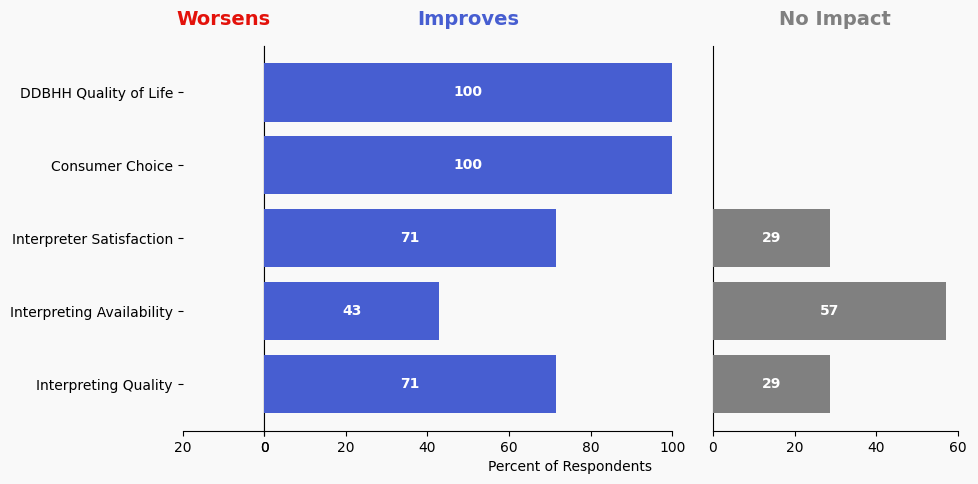
The stacked bar charts show how respondents assessed the effectiveness of this solution based on five metrics. For each metric, the percentage of respondents is shown from left to right: Worsens (Red), Improves (Blue), No Impact (Gray).
DDBHH Quality of Life
Makes It Worse 0%
Makes It Better 100%
No Impact 0%
Interpreter Satisfaction
Makes It Worse 0%
Makes It Better 71%
No Impact 28%
Consumer Choice
Makes It Worse 0%
Makes It Better 100%
No Impact 0%
Interpreting Availability
Makes It Worse 0%
Makes It Better 42%
No Impact 57%
Interpreting Quality
Makes It Worse 0%
Makes It Better 71%
No Impact 28%
Reviewer Feedback and Insights
Interpreter
No comments were submitted.
Deaf, DeafBlind, Hard of Hearing
No comments were submitted.
System Stakeholder
No comments were submitted.
PREVIOUS SOLUTION
Issue: K12 settings in Greater Minnesota are struggling to fill interpreting positions with qualified individuals. State Services’ ASL Interpreting Student Internship for Greater Minnesota grant is seeking internship sites.
NEXT SOLUTION
69 Create Roster of Interpreters Qualified to Work in K12
Issue: There is no public roster of Certified Interpreters qualified to work in K12 educational settings.
Leave a Reply