66 Establish Fund to Offer Moving Bonuses to Out-of-State Interpreters Moving to Minnesota
Issue: interpreter shortage
Proposed Solution: Coalition seek funding to provide moving bonuses to out-of-state interpreters moving to Minnesota. Provide higher bonuses for interpreters moving to Greater Minnesota.
Expected outcome: Increased availability of interpreting services in Minnesota
Who is impacted: Consumers, hiring entities, interpreters (instate and outstate)
Timeline: 6 months

Summary of Support Image Description
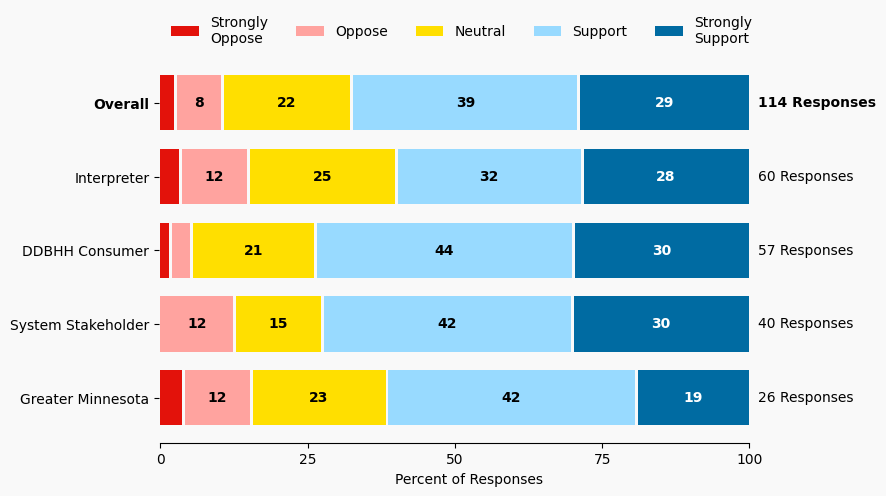
The stacked bar charts show how respondents rated their level of support and the total number of responses. The percentage for the five support levels is shown from left to right: Strongly Oppose (Dark Red), Oppose (Light Red), Neutral (Yellow), Support (Light Blue), and Strongly Support (Dark Blue).
Respondents may identify with multiple subgroups. The overall level of support is:
Overall
Strongly Oppose: 3%
Oppose: 8%
Neutral: 22%
Support: 39%
Strongly Support: 28%
Click to see the detailed image description for each subgroup.
Interpreter
Strongly Oppose: 3%
Oppose: 12%
Neutral: 25%
Support: 32%
Strongly Support: 28%
Greater Minnesota
Strongly Oppose: 4%
Oppose: 12%
Neutral: 23%
Support: 42%
Strongly Support: 19%
DDBHH Consumer
Strongly Oppose: 2%
Oppose: 4%
Neutral: 21%
Support: 44%
Strongly Support: 30%
System Stakeholder
Strongly Oppose: 0%
Oppose: 12%
Neutral: 15%
Support: 42%
Strongly Support: 30%
Overview of Respondents Opting for In-Depth Solution Analysis
After indicating their support level, 1% of the 114 respondents opted in to further assess whether the solution would worsen or improve on five metrics. Of the opt-in reviewers (2 respondents), 50% supported the solution, 0% were neutral on the solution, and 50% opposed the solution.
The remaining 112 respondents did not opt in to further assess the solution. Of these people, 67% support the solution, 22% were neutral on the solution, and 9% opposed the solution.
Reviewer Evaluation of Solution Effectiveness

Solution Effectiveness Image Description
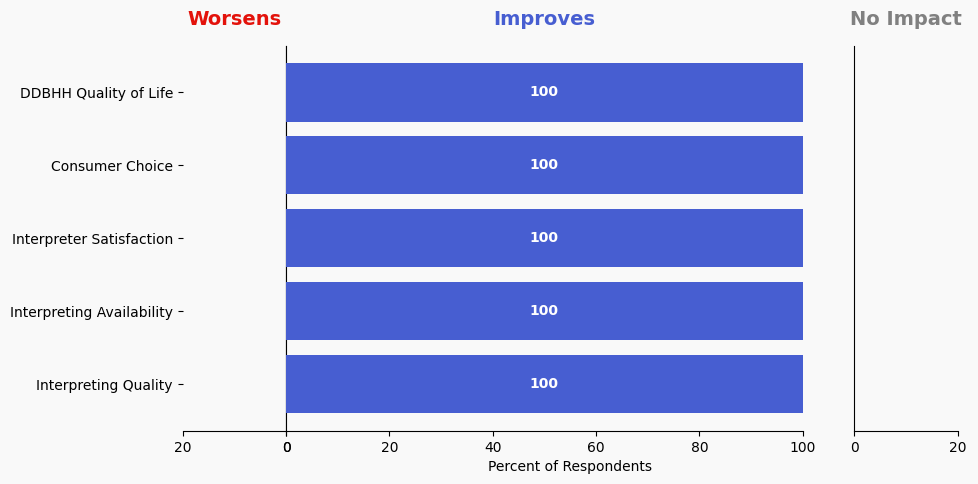
The stacked bar charts show how respondents assessed the effectiveness of this solution based on five metrics. For each metric, the percentage of respondents is shown from left to right: Worsens (Red), Improves (Blue), No Impact (Gray).
DDBHH Quality of Life
Makes It Worse 0%
Makes It Better 100%
No Impact 0%
Interpreter Satisfaction
Makes It Worse 0%
Makes It Better 100%
No Impact 0%
Consumer Choice
Makes It Worse 0%
Makes It Better 100%
No Impact 0%
Interpreting Availability
Makes It Worse 0%
Makes It Better 100%
No Impact 0%
Interpreting Quality
Makes It Worse 0%
Makes It Better 100%
No Impact 0%
Reviewer Feedback and Insights
Interpreter
No comments were submitted.
Deaf, DeafBlind, Hard of Hearing
No comments were submitted.
System Stakeholder
Comments from System stakeholders express concerns that offering a moving bonus may unintentionally cause a shortage of interpreters in other states, negatively affecting DDBHH access elsewhere.
PREVIOUS SOLUTION
65 Develop Legislation and Mechanism to Prohibit Unqualified K12 Educational Interpreters
Issue: School districts, particularly in Greater Minnesota, may be hiring “Langauge Facilitators” and “ASL Paraprofessionals” who are functioning in the role of an interpreter. While a Paraprofessional with ASL competency may be a valid need, oversight is needed to ensure that school districts are not hiring unqualified individuals to serve as working interpreters.
NEXT SOLUTION
Issue: K12 settings in Greater Minnesota are struggling to fill interpreting positions with qualified individuals. State Services’ ASL Interpreting Student Internship for Greater Minnesota grant is seeking internship sites.
Leave a Reply